Estimating Cyber Loss Magnitude: Practical approaches for risk modelling
Our approach to estimating loss in monetary value from cyber-related risks

Skrevet av:

TL;DR
In this blog post, we will show how to use default values when estimating the potential costs of different cyber risks. These default values will prove helpful whenever numbers based on own organisational context are unavailable.
It will become clear that an accurate estimation is essential for cyber risk modelling, and that while benchmark default values provide a valuable starting point, organisational context should always take priority. In this blog post, we’ll show how we recommend that organisations weigh and determine organisational context. We will also share how we lean on a range of different sources when calculating potential loss from cyber-related risks.
Our aim is for this blog post to open up discussion and further reflection on how we quantify cyber risks, and how we arrive at that final number.
Background
Over the past months, I’ve been contributing to an innovation project called CyberRisk. Its primary goal is to semi-automate the digital risk management process, in order to find new methods for analysis of security data. The project also aims to improve the understanding of risk among decision-makers by finding new methods for presenting risk information.
Defining Loss Magnitude
One of our key steps has been evaluating different risk quantification methods; approaches that aim to measure cybersecurity risk in numerical terms. To make it easier to compare, prioritise, and communicate risks.
Among the most widely recognised methods is FAIR (Factor Analysis of Information Risk), which quantifies risk by modelling the frequency and scale of potential financial losses.
We chose not to adopt the FAIR methodology for quantifying likelihood, and instead we use machine learning algorithms based on available data. However, we did adapt FAIR’s approach to presenting the consequence component of risk: Loss Magnitude
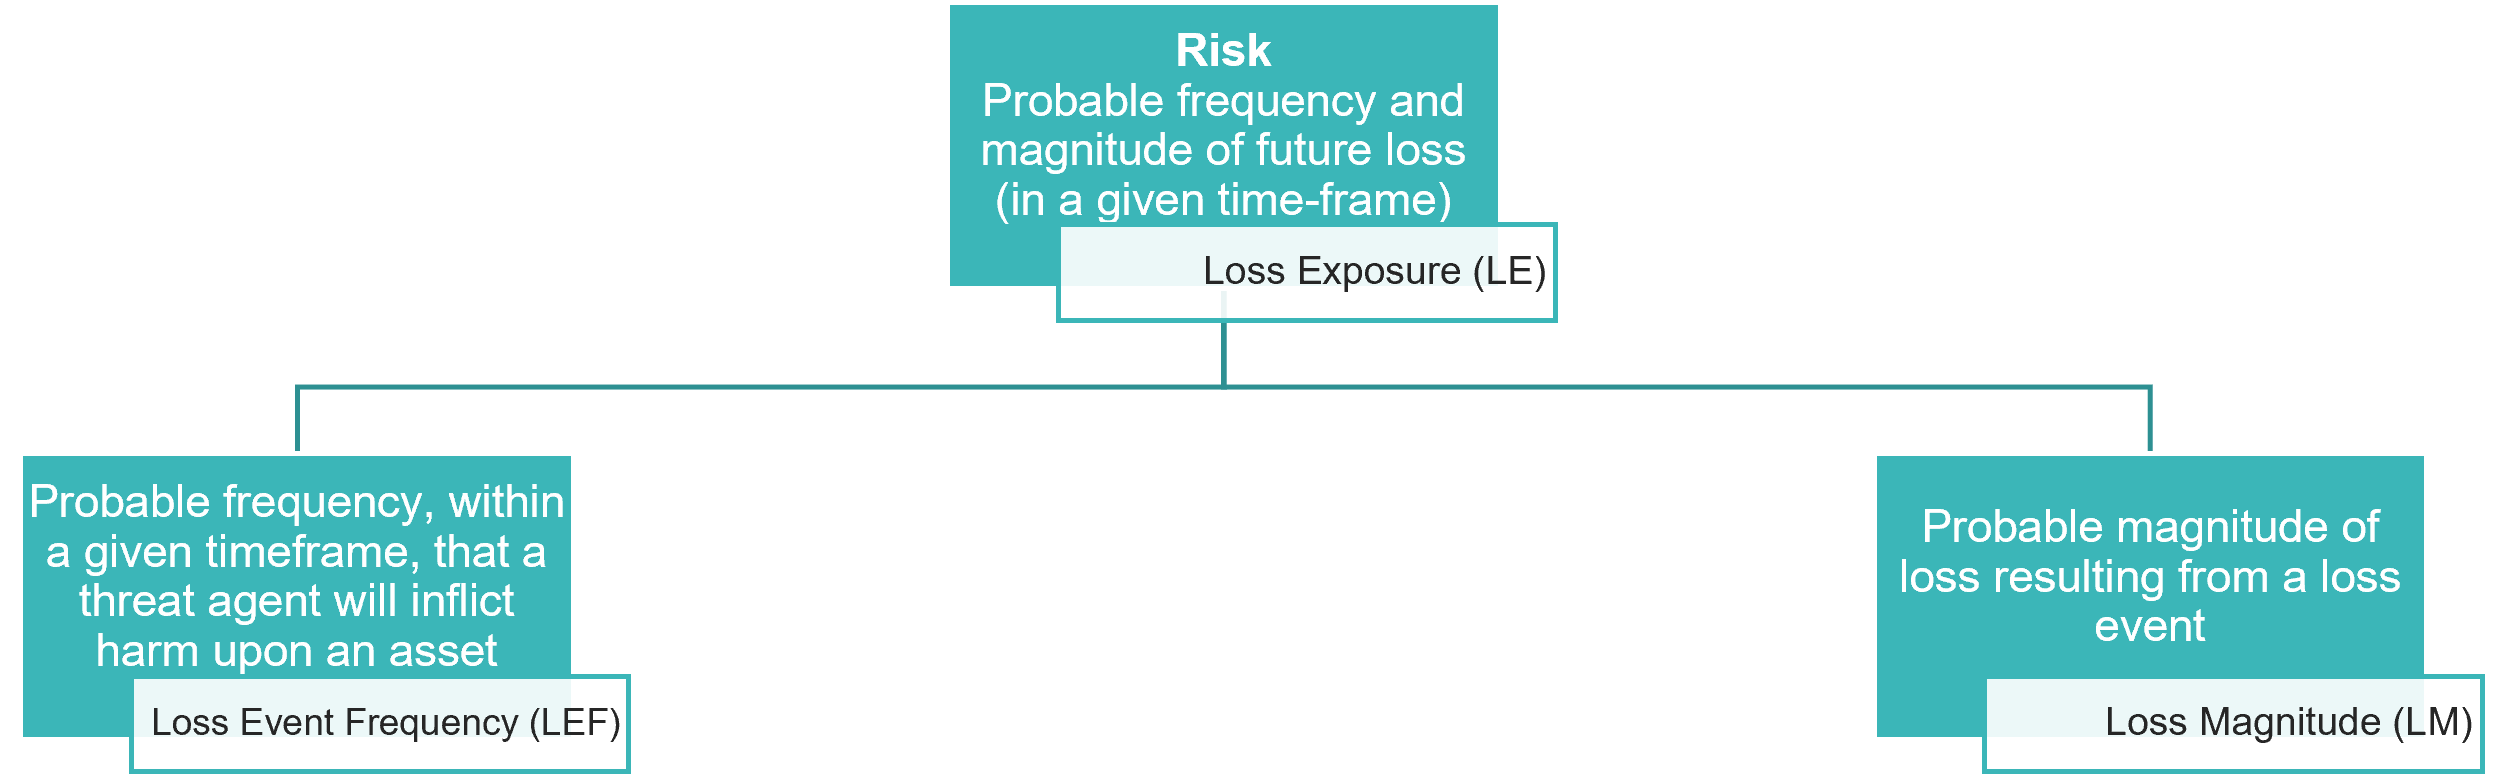
We defined Loss Magnitude as the probable magnitude of loss in monetary value for a specific business process. It is represented using four values:
- Minimum Value: The least amount of loss you could foresee.
- Most Likely Value: The amount of loss you believe is most probable
- Maximum Value: The highest potential loss you could foresee.
- Confidence: A score from 0 (no confidence) to 1 (complete certainty) capturing how precise your calculation of the three estimates above are.
When possible, an organisation should provide these values based on their own business context. However, as this is not always available, it is useful to explore default values grounded in available research as a substitute.
Selecting the Most Likely Value
Finding the Most Likely Value is far from a straightforward calculation. In order to do so, we need to base our estimates on a range of different sources. Some of which are aligned, while others go in different directions.
The 2025 IBM Cost of a Data Breach Report places the global average cost of a data breach at $4.44M (down from $4.88M the previous year).
Comparisons with other sources do not contradict this estimate:
- Verizon Data Breach Investigations Report 2025 places the median BEC fraud at $50K and the median ransomware payout at $115 K.
- Sophos The State of ransomware 2025 places the median ransomware recovery cost at $1.53M and the median ransomware payout at $1M.
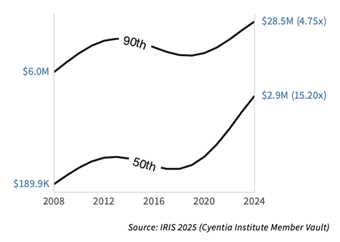
However, the 2025 Information Risk Insights Study (IRIS), exploring the distribution of financial losses from cyber events, presents a different perspective:
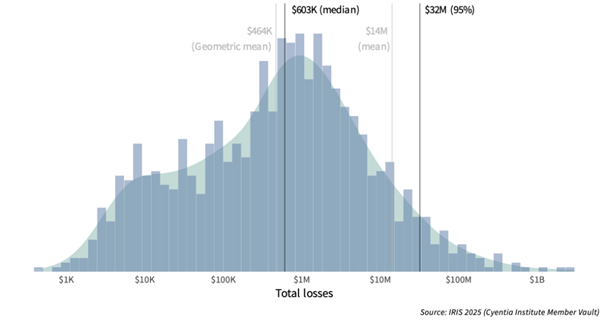
Note that losses analysed in this study tend to reflect direct losses that are easier to quantify (e.g. response costs or lost revenue), and/or losses from public records (e.g. class action suits or U.S. Securities and Exchange Commission (SEC) filings). Indirect and intangible impacts often aren’t captured. Thus, this represents a more conservative view of financial losses associated with cyber events.
IRIS places the Most Likely Value (by investigating losses from 2015 to 2024) at $603K. As seen in the figure above, the growing “shoulder” in the lower part of the distribution pulls the geometric mean down. This means the median is a better measure for the updated distribution. It’s worth noting that this is a lot less than the $4.4M from IBM.
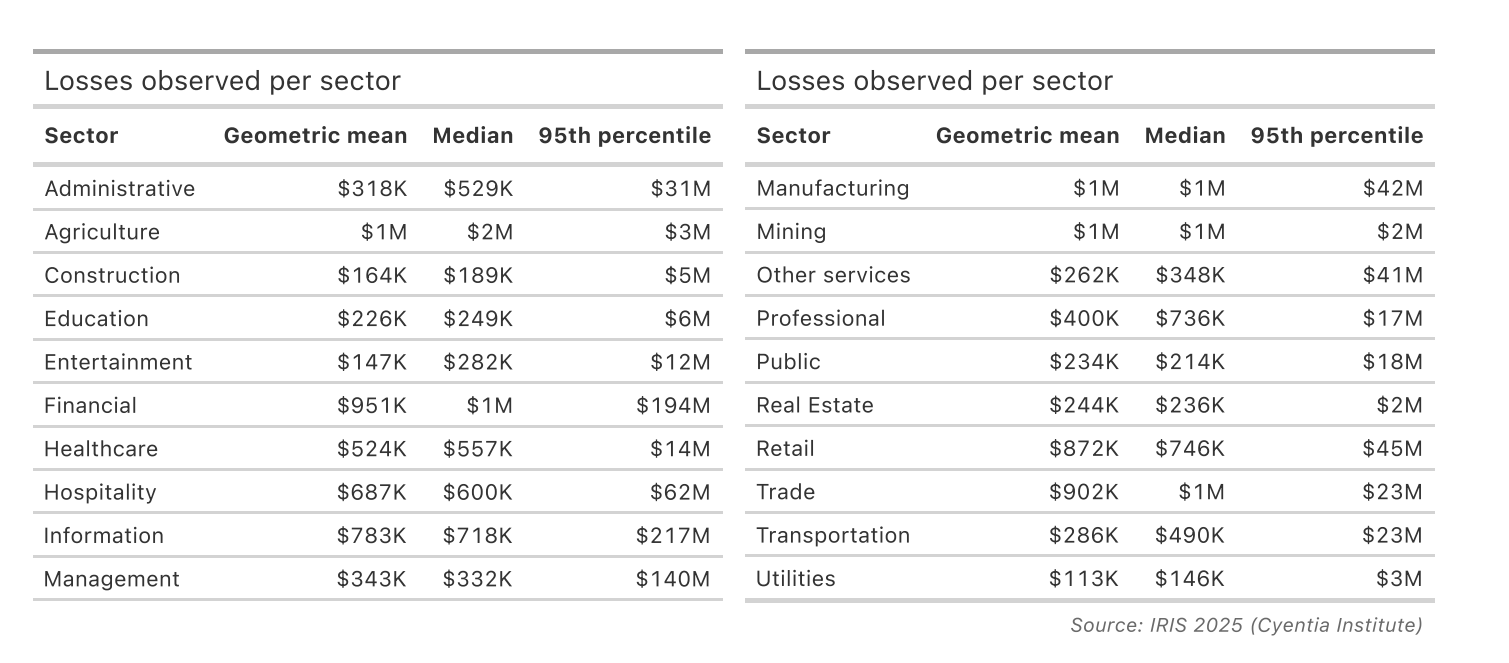
We could adjust per sector:
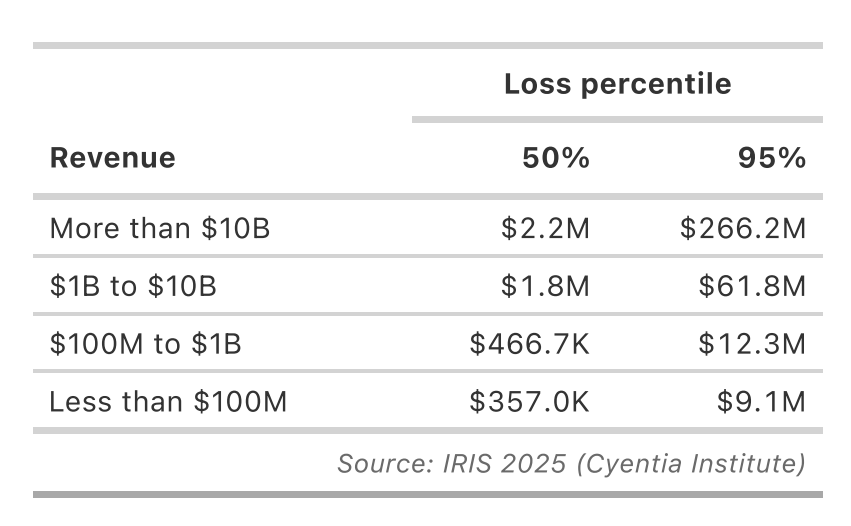
Or revenue:
But, if we look into the 2024 cost instead of the longer time period investigated above (2015-2024), the value comes closer to $2.9M:
Adjusting for geography
IBM also produces an Average cost of a data breach by country view that we have looked at to model losses for Norwegian enterprises as an example:
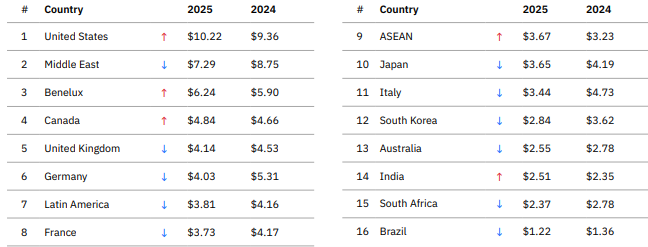
Even though the IRIS 2025 median is conservatively set at $2.9M, it is worth repeating that it is based only on direct losses across a wide range of organisations. The IBM global average of $4.4M includes a broader view of losses, but includes outlier countries like the United States ($10.2M), which skews the mean upwards. In our calculations, we view Norway as most comparable to:
- Germany: $4.03M
- UK: $4.14M
- Benelux: $6.24M
Therefore using the global average of $4.44M as the Most Likely Value for Norwegian organisations appears reasonable.
Setting Minimum and Maximum Values
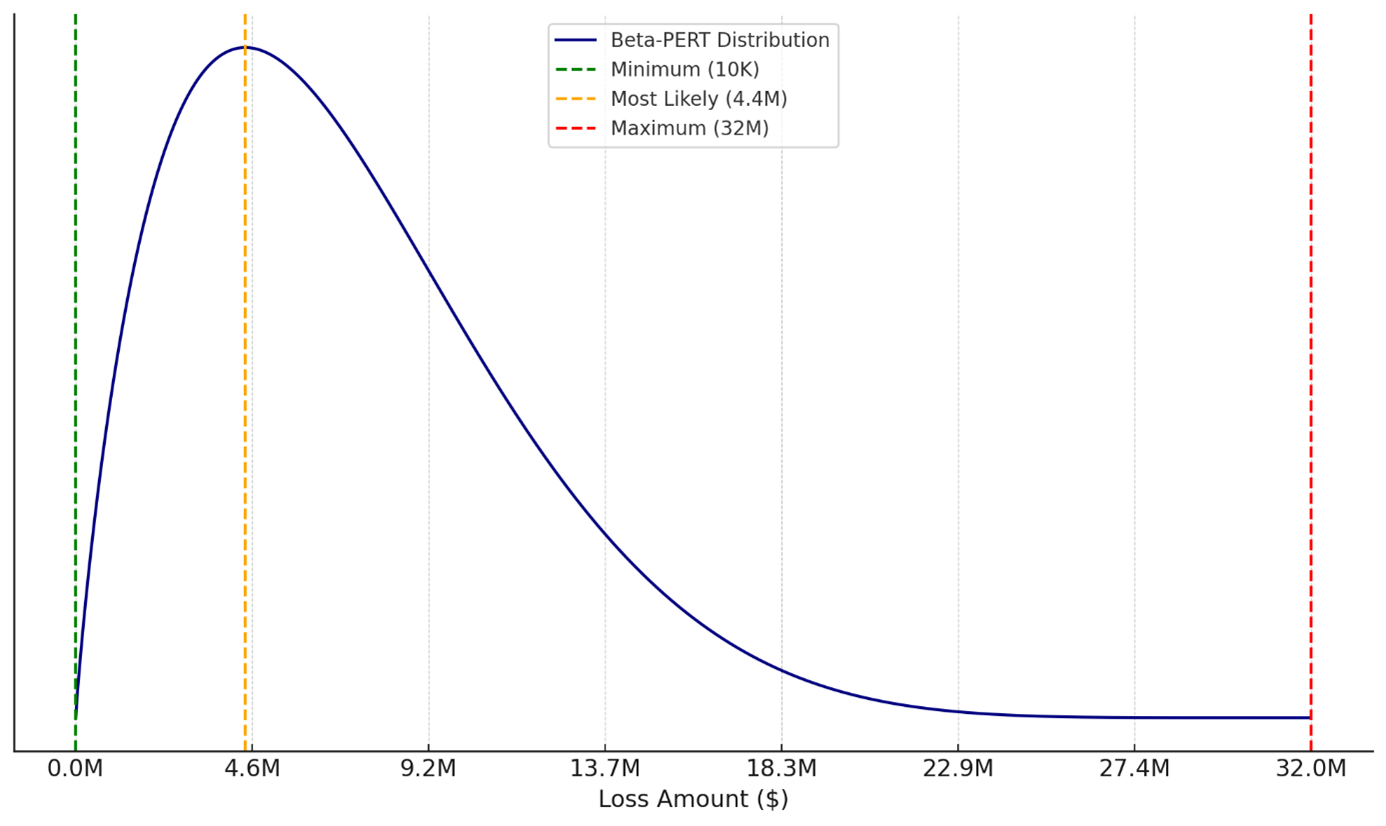
After studying the Figure 2: IRIS 2025 - distribution of reported losses for security incidents from 2015 to 2024 above, we choose $10K as the Minimum Value and $32M as the Maximum Value, rather than using extreme values like $1K and $100M.
This is both a practical and methodologically sound decision in the context of loss modelling and risk analysis, as we make sure extreme low or high outlier numbers do not affect our estimate.
The minimum ($10K) is operationally meaningful:
- $1K might be theoretical, but in practice, very small losses are absorbed operationally and not typically recorded or modeled.
- $10K aligns better with the smallest reported incident-level loss that would trigger attention or response in most organisations.
The maximum ($32M) is empirically based on the IRIS 2025 data:
- $32M is the 95th percentile, meaning 95% of losses fall below it.
- Using $100M as the max gives undue weight to very rare events causing high outlier numbers.
These are some examples of high-profile cases that would become outliers in our estimate because of the high monetary losses:
- Marks & Spencer ransomware 2015 = $400M
- Change Healthcare, 2024 = $2.9B
- Norsk Hydro ransomware, 2019=$71 million
- Equifax's Data Breach 2017-2019= $1.4B
- Maersk NotPetya, 2017= $300M
Visualising the expected loss distribution
An example distribution of expected losses could look like this:
Our learnings and how to go forward
Accurate estimation of Loss Magnitude is essential for credible cyber risk modelling. While global benchmarks like those from IBM and IRIS provide valuable starting points, organisational context should always take priority.
Use the following questions when estimating these values, and consider the availability of data, past experiences, and uncertainty when assigning your confidence level.
|
1. What financial losses will your organisation likely experience if this business process is affected by a loss event? When estimating these losses, consider: |
a. Productivity losses: Time and output lost due to the disruption. E.g. b. Response costs: Expenses related to mitigating, resolving, or containing the event. E.g. c. Replacement costs: The cost of replacing physical or digital assets, including technology, infrastructure, or intellectual property. E.g. |
|
2. In addition to the primary losses in step one, estimate the potential financial impact of secondary losses resulting from external stakeholders’ reactions. These losses are harder to predict, but they often carry significant long-term consequences. Consider: |
a. Fines and legal judgments: Regulatory penalties, legal settlements, or litigation costs. E.g. b. Reputational damage: Loss of customer trust, reduced market share, or adverse media coverage leading to long-term brand erosion. E.g. c. Loss of competitive advantage: Potential loss of business opportunities, intellectual property, or customers to competitors exploiting the situation. E.g. |
As a final remark, I’ll admit these global benchmark values are sometimes hard to accept for me when I compare them with my own perception of the Norwegian market, and numbers from Norwegian surveys such as Mørketallsundersøkelsen.
The gap between what research suggests and what many of us intuitively expect highlights just how challenging it can be to ground risk quantification in practical reality. The differences raise an important question: are we overestimating, underestimating, or simply not looking at losses the right way?
I’d love to hear your thoughts. Do these figures reflect your experience, or do they feel disconnected from reality? Do you share our approach to reaching these estimates, or does yours differ from ours?
Ta kontakt
